How to Remove Grid Lines in Chart JS 3 and Up

Jasser Mark Arioste

Hello! In this tutorial, you'll learn how to remove grid lines for chart.js 3 and up.
Introduction #
Chart.js is a charting library for javascript applications. It is currently the most popular charting library with more than 60k Github stars. It provides you with basic chart types such as line chart, bar chart, pie chart, etc. It also comes with Typescript support out-of-the-box starting from version 3. It's really easy to setup but there are a lot of options so it takes a while to get used to and familiarize with.
Recently, I had to implement a line chart where I had to remove the grid lines in a React application. So now, I'm writing a guide to share my thoughts and findings. I hope you find it helpful. I'm also using typescript in this tutorial for clarity and maintainability.
Tutorial Objectives #
By the end of this tutorial, you should be able to learn the following:
- Remove grid lines from the chart area only by using the options property.
- Remove grid lines including x and y axes by using the options property.
- Remove ticks and labels from x and y axes
- Set the default settings to not display grid lines by default.
Removing The Grid Lines in Chart Area #
To remove the grid lines inside the chart area, you can use the following options for your chart:
import Chart, { ChartOptions } from "chart.js/auto";
// ...

  const options: ChartOptions = {
      scales: {
        x: {
          grid: {
            display: false,
          },
        },
        y: {
          grid: {
            display: false,
          },
        },
      },
    };
// ...
const canvas = document.getElementById("myChart") as HTMLCanvasElement;
const ctx = canvas.getContext("2d");
const chart = new Chart(ctx!, {
  options,
  data
});123456789101112131415161718192021222324
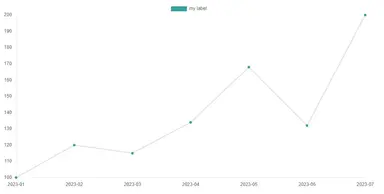
When using this option, you'll get the following result:

Removing All Grid Lines #
The previous example is already good, but sometimes you need a chart without all the lines including the x and y axes. To remove lines from the axes, you'll have to include the `border.display` option. For example:
import Chart, { ChartOptions } from "chart.js/auto";
const options: ChartOptions = {
  scales: {
    x: {
      grid: {
        display: false,
      },
      border: {
        display: false,
      },
    },
    y: {
      grid: {
        display: false,
      },
      border: {
        display: false,
      },
    },
  },
};

const chart = new Chart(ctx!, {
  options: options,
  type: "line",
  data: data
})123456789101112131415161718192021222324252627
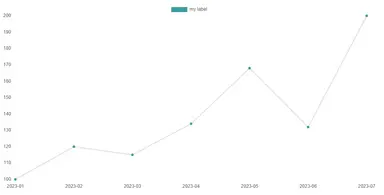
When using this option, you'll get the following result:

Removing the Ticks and Labels, and Legend #
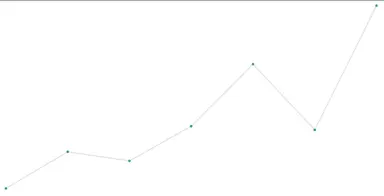
Sometimes you want a plain graph without all the ticks, labels, and legends. This is useful when you have limited space or want to show the progress of a certain chart if it's trending up or down. To do this you'll have to include the scales.x.ticks.display and plugins.legend.display options. For example:
import Chart, { ChartOptions } from "chart.js/auto"; const options: ChartOptions = { scales: { x: { grid: { display: false, }, border: { display: false, }, ticks: { display: false, }, }, y: { grid: { display: false, }, border: { display: false, }, ticks: { display: false, }, }, }, plugins: { legend: { display: false, }, }, }; const chart = new Chart(ctx!, { options: options, type: "line", data: data, });1234567891011121314151617181920212223242526272829303132333435363738
When using this setup, you'll get the following result:

Remove Grid Lines By Settings the Defaults #
Notice that the latest example has a bit of code. One way to clean this up is by setting the ChartJS defaults to not display these options in the first place. You can do so by modifying the properties of the Chart.defaults object. For example:
// remove grid lines from chart area
Chart.defaults.scale.grid.display = false;
// remove ticks
Chart.defaults.scale.ticks.display = false;
// remove border from x and y axes
//@ts-ignore
Chart.defaults.scale.border.display = false;
// remove legend
Chart.defaults.plugins.legend.display = false;

const chart = new Chart(ctx!, {
  options: {},
  type: "line",
  data: data
})123456789101112131415
With this setup, you'll have the same output as the previous example.
Conclusion #
You learn how to remove grid lines in chart.js 3 and up. Chart.js has a lot of options and hopefully, this helped you find the right setup for your charts. If not, you can always refer to the documentation. Each version has its specific documentation for options and plugins.
If you like this tutorial, please leave a like or share this article. For future tutorials like this, please subscribe to our newsletter or follow me on GitHub.
Resources #
Credits: Image by David Mark from Pixabay


