How to Add ChartJS in NextJS 13

Jasser Mark Arioste

Hello! In this tutorial, you'll learn how to set up ChartJS in a Next 13 project.
Introduction #
If you're tasked with creating a chart for your project, ChartJS is a popular choice among developers. ChartJS is not dependent on any javascript framework and can be used with all frameworks out there. There are specific integrations for these frameworks and it's the same with React/NextJS. For React, we're going to use the react-chart-js-2 library, which is recommended by the official documentation.
How to Set Up ChartJS in NextJS #
Setting up ChartJS in NextJS is essentially the same as setting it up in React since NextJS is a React Framework. However, I understand that there could be some confusion as to how to implement it in code. But in general, it should all be the same steps:
- Install the required dependencies
- Import the necessary controllers, elements, and plugins from ChartJS.
- Create/Implement the React Component
Final Output #
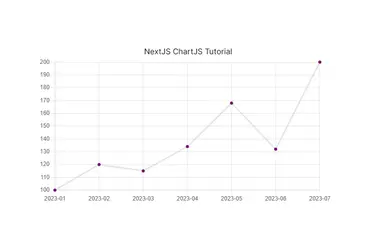
Below is the final output of what you'll be making today. You'll be making a line chart that looks like this:

Step 1: Creating a New Next 13 Project #
If you already have an existing NextJS Project, you may skip this step and proceed to Step 2. First, let's create a new NextJS project by using the create-next-app command line interface (CLI). Note that it's important to use @latest so that you always get the latest version.
npx create-next-app@latest --ts --app next-chart-js-setupThe --ts option is to initialize the project with Typescript and the --app option is to initialize the project with the /app folder as opposed to the /pages folder. If you're using tailwind, you can easily add it by adding a --tailwind option and the create-next-app CLI will take care of everything for you.
Step 2: Installing the Dependencies #
Next is to install the dependencies for ChartJS. So as I've mentioned previously, ChartJS is independent of javascript frameworks and libraries. They have several integrations with popular javascript libraries and React is included. We are going to use react-chart-js-2 as it's recommended by the official documentation.
Run the following command to install the dependencies:
yarn add chart.js react-chartjs-2Step 3: Importing and Registering the ChartJS Components #
It's important to remember that different charts have different elements required. This is needed to optimize the bundling process.
If you don't import the correct scale or element, NextJS will throw an error. For example, creating a <Line/> chart but not registering the LineElement will result in the following error:
Error: "line" is not a registered element.1
To know which ChartJS components are required for specific charts you should refer to the documentation here.
All right, let's say you want to create a <Line> chart component. First, create the file components/MyLineChart.tsx. We refer to the documentation and see that the required elements for the Line chart are the following, CategoryScale, LinearScale, PointElement, and LineElement.
So inside our file, we also register these elements to ChartJS. For example:
// components/MyLineChart.tsx
"use client";
import {
  Chart as ChartJS,
  CategoryScale,
  LinearScale,
  Tooltip,
  PointElement,
  LineElement,
} from "chart.js";
import { Line } from "react-chartjs-2";

// Register ChartJS components using ChartJS.register
ChartJS.register(
  CategoryScale,
  LinearScale,
  PointElement,
  LineElement,
  Tooltip
);1234567891011121314151617181920
The Tooltip is an optional plugin that you can add to your chart for better usability.
Step 4: Creating the React Component #
The next step is to define the React component itself. For example:
// components/MyLineChart.tsx // ... ChartJS.register(CategoryScale, /* ... */) // ... const MyLineChart = () => { return ( <div> <Line data={{ labels: [ "2023-01", "2023-02", "2023-03", "2023-04", "2023-05", "2023-06", "2023-07", ], datasets: [ { data: [100, 120, 115, 134, 168, 132, 200], backgroundColor: "purple", }, ], }} /> </div> ); }; export default MyChart;123456789101112131415161718192021222324252627282930
Here I just hard-coded the data and settings for tutorial purposes. But in your case, the data here is usually from an external API. After this step, you should have the same output as the final output above.
That's basically it!
Conclusion #
You learned how to set up ChartJS in a NextJS project.
If you like this tutorial, please leave a like or share this article. For future tutorials like this, please subscribe to our newsletter or follow me on GitHub.
Resources #
Credits: Image by SEMEN MAKSIMISHIN from Pixabay


