How to Customize Chart.js 3 Events with React

Jasser Mark Arioste

Creating interactive and customizable charts is an essential part of data visualization in web applications. Chart.js is a popular JavaScript library for creating charts and graphs. With the release of Chart.js 3, it offers more powerful features and better integration with React. In this article, we'll explore how to customize events in Chart.js 3 when using it with React. We'll also use typescript in this tutorial.
Setting Up the Environment #
Before we dive into customizing events, you'll need to set up your development environment. Ensure you have Node.js and npm installed. You can initiate a new React project using Create Next App or your preferred setup.
npx create-next-app@latest --ts --app chartjs-react-events
cd chartjs-react-events
Next, install Chart.js 3 and the React wrapper for Chart.js
yarn add chart.js react-chartjs-2Now that your environment is set up, we can start customizing Chart.js 3 events.
Creating a Simple Chart #
To get started, let's create a simple bar chart. We'll use Chart.js 3 with the React wrapper. First, create a new component for your chart. In the src/components directory, create a new file, e.g., BarChart.tsx, and set up a basic bar chart:
"use client"; import { BubbleDataPoint, ChartData, Point, Chart, CategoryScale, LinearScale, BarElement, Legend, } from "chart.js"; import React, { useRef } from "react"; import { Bar } from "react-chartjs-2"; // register components for the barchart. // we also register legend since we're customizing legend events. Chart.register(CategoryScale, LinearScale, BarElement, Legend); const data: BarChartData = { labels: ["January", "February", "March", "April", "May"], datasets: [ { label: "Legend 1", data: [12, 19, 3, 5, 2], backgroundColor: "rgba(75, 192, 192, 0.2)", borderColor: "rgba(75, 192, 192, 1)", borderWidth: 1, }, { label: "Legend 2", data: [12, 19, 5, 8, 21], backgroundColor: "rgba(75, 255, 34, 0.2)", borderColor: "rgba(75, 255, 34, 1)", borderWidth: 1, }, ], }; const options = { // Customize your chart options here }; const BarChart = () => { return <Bar data={data} options={options} />; }; export default BarChart;12345678910111213141516171819202122232425262728293031323334353637383940414243444546
Customizing Events #
Now, let's explore how to customize events in your chart. Chart.js 3 provides a mechanism to handle various events, such as click events, hover events, and more. To do this, you can add event listeners and callbacks to your chart options.
It can be common to want to trigger different behavior when clicking an item in the legend. Here's an example of customizing the legend click event in your bar chart:
... const BarChart = () => { return ( <Bar data={data} options={{ plugins: { legend: { display: true, position: "top", onClick(e, legendItem, legend) { // handle onclick event here. const index = legendItem.datasetIndex!; legendItem.hidden = !legendItem.hidden; this.chart.getDatasetMeta(index).hidden = legendItem.hidden; // don't forget to call this.chart.update() to re-render the chart! this.chart.update(); }, }, }, responsive: true, maintainAspectRatio: false, }} /> ); };1234567891011121314151617181920212223242526
Note that we're not using react hooks such as useState to update the chart but we're using its internal state instead. This is much more efficient.
For more information about legends, please refer to the docs.
This is all good, but what if you want to control the chart from another component outside the chart?
Controlling Chart.js from another component #
Let's we want to have a button to hide/show all the legend items. Here's how to do it.
...
const BarChart = () => {
  // use useRef hook to get a hold of the chart object
  const ref = useRef<any>(null);
  // a state to track hide/show all
  const [hideAll, setHideAll] = useState(false);
  return (
    <>
      <button
        className="bg-violet-200 border rounded-md border-violet-400 px-4 py-2"
        onClick={() => {
          const chart = ref.current as Chart;
          const newState = !hideAll;
          if (chart) {
            setHideAll(newState);
            // toggle legend and dataset `hidden` state
            chart.legend?.legendItems?.forEach((item, index) => {
              item.hidden = newState;
              chart.getDatasetMeta(index).hidden = newState;
            });
            // don't forget to call this.chart.update() to re-render the chart!
            chart.update();
          }
        }}
      >
        Hide/Show all Data
      </button>
      <Bar
        data={data}
        ref={ref}
        options={{
          plugins: {
            legend: {
              display: true,
              position: "top",
              onClick(e, legendItem, legend) {
                // handle onclick event here.
                const index = legendItem.datasetIndex!;
                legendItem.hidden = !legendItem.hidden;
                this.chart.getDatasetMeta(index).hidden = legendItem.hidden;
                // don't forget to call this.chart.update() to re-render the chart!
                this.chart.update();
              },
            },
          },
          responsive: true,
        }}
      />
    </>
  );
};123456789101112131415161718192021222324252627282930313233343536373839404142434445464748495051
Explanation:
First, we use the useRef hook to get a hold of the chart object. Once we have that, we use it for click events and all the other stuff.
Demo #
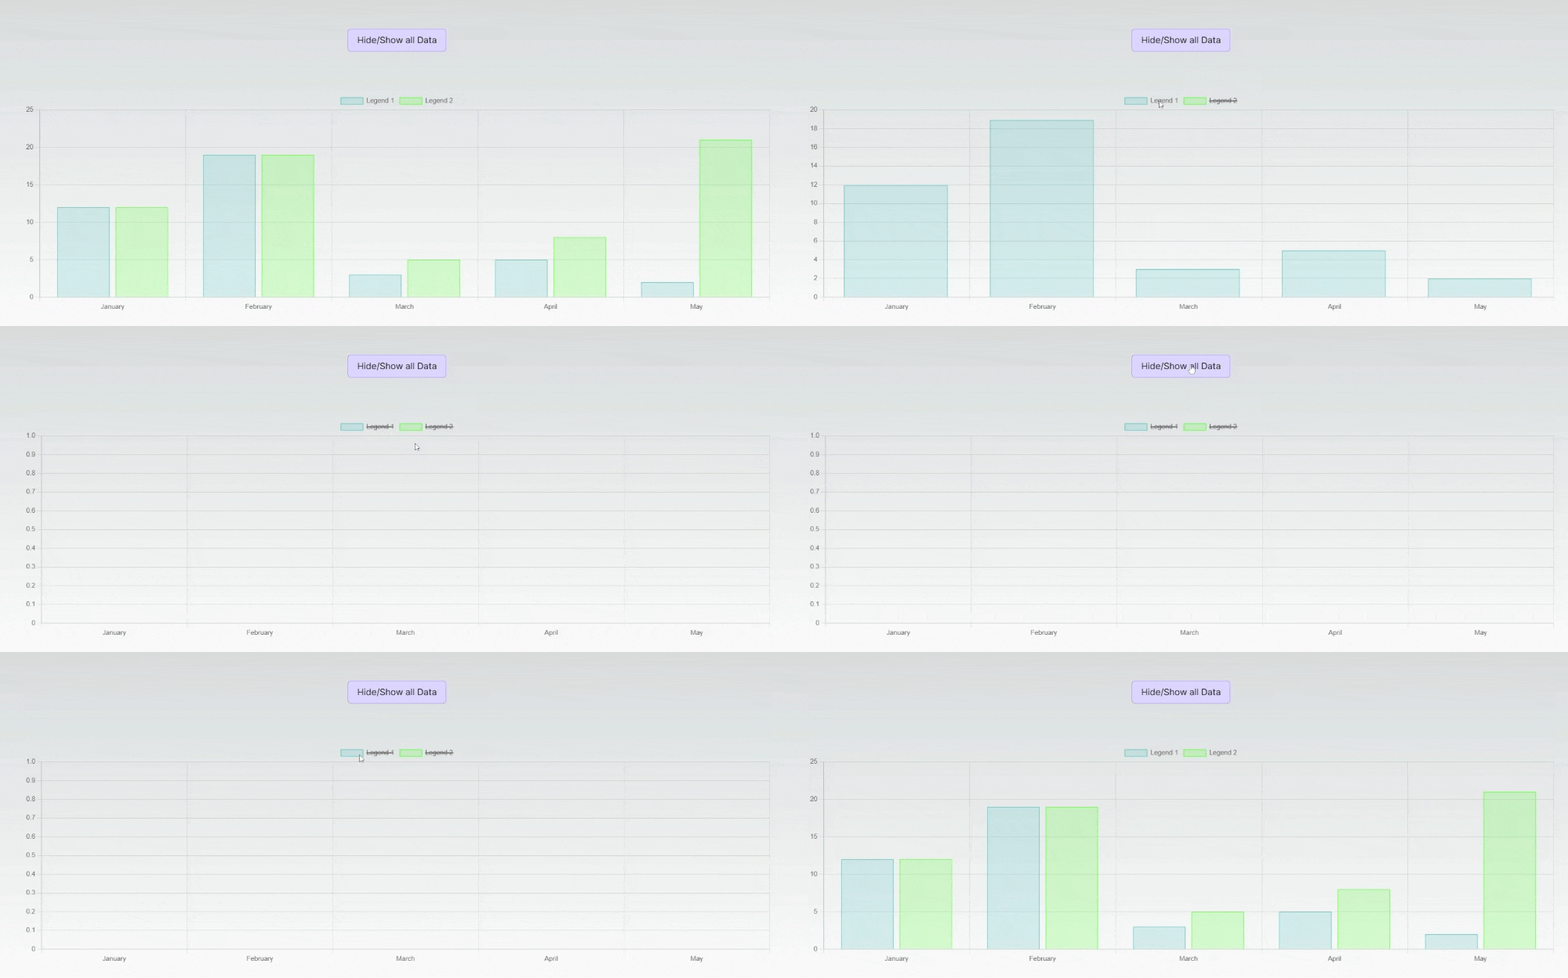
Here's the demo of all the things we did in this tutorial:

Conclusion #
Customizing events in Chart.js 3 with React allows you to create interactive and dynamic data visualizations. You can respond to user interactions and apply custom styling to make your charts more engaging and informative. Experiment with the provided event callbacks and explore the extensive customization options offered by Chart.js to create charts that best suit your project's needs.
Credits: Image by Peter H from Pixabay


