How to Remove Grid Lines in Chart JS 2 and below

Jasser Mark Arioste

Hello! In this tutorial, you'll learn how to remove the grid lines when making charts in Chart.js version 2.
Introduction #
Chart.js is a popular, open-source charting library for the web. It's very simple and easy to use, but if you're new to chart.js, finding the right options for your chart might too overwhelming since they have a lot of options to customize your charts.
In this tutorial, you'll learn about all the options for removing the grid lines. If you're using version 3 and up, I've written another article for that: Removing Grid Lines in ChartJS 3 and up. Note that I'm using typescript so I have complete access to the intellisense or code auto-completion from my VS code editor.
Tutorial Objectives #
By the end of this tutorial, you'll learn how to do the following:
- Remove grid lines from individual charts
- Remove grid lines from the chart area only
- Remove grid lines from charts using default settings
Removing All Grid Lines #
To completely remove grid lines including the non-chart area in chart.js 2 from an individual chart, you have to set the following options:
const options: Chart.ChartOptions = {
  scales: {
    xAxes: [
      {
        gridLines: {
          display: false,
        },
      },
    ],
    yAxes: [
      {
        gridLines: {
          display: false,
        },
      },
    ],
  },
};

const chart = new Chart(ctx, {
  options: options,
  type: "line",
  data: data
})123456789101112131415161718192021222324
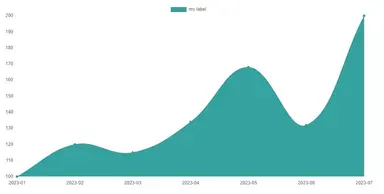
Here's the output:

Removing Grid Lines from Chart Area Only #
Note that in the previous example, this also removed the grid lines from outside the chart area. To remove the lines from only the chart area, you have to use the drawOnChartArea option. Change your setting to the following:
const options: Chart.ChartOptions = {
  scales: {
    xAxes: [
      {
        gridLines: {
          drawOnChartArea: false,
        },
      },
    ],
    yAxes: [
      {
        gridLines: {
          drawOnChartArea: false,
        },
      },
    ],
  },
};123456789101112131415161718
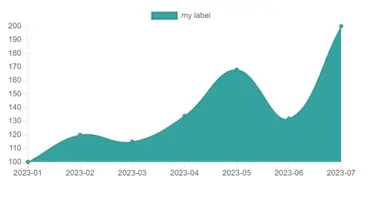
Here's the output:

Globally Removing Grid Lines #
Chart.js displays all the gridlines for all charts by default. However, you can also set the defaults so that it doesn't display the gridlines by default:
import Chart from "chart.js";
// remove all the grid lines by default
Chart.defaults.scale.gridLines.display = false;
// remove all the grid lines for chart area only:
Chart.defaults.scale.gridLines.drawOnChartArea = false;12345
Note that when using this technique, it doesn't give you the intellisense due to its type definition which is the following:
Chart.defaults: {
    [key: string]: any;
    global: Chart.ChartOptions & Chart.ChartFontOptions & {
        tooltips: Chart.ChartTooltipOptions;
    };
}123456
Conclusion #
You learned how to remove grid lines in Chart.js 2 in different ways and settings. I hope this tutorial, helped you a bit in finding which options are best for your chart implementation.
If you like this tutorial, please leave a like or share this article. For future tutorials like this, please subscribe to our newsletter or follow me on GitHub.
Resources #
Credits: Image by ❄️♡💛♡❄️ Julita ❄️♡💛♡❄️ from Pixabay


