How to Update ChartJS Data with React

Jasser Mark Arioste

Hello! In this tutorial, you'll learn how to update ChartJS data using React. We'll use NextJS as our react framework since we'll also implement a simple backend API for fetching ChartJS data.
I recently implemented a chart that updates the data based on the granularity of the dates and I'd like to share how I did it in this tutorial.
When using React with ChartJS, it's really easy to update the data since we can just rely on props to re-render the ChartJS component. If you're having trouble, hopefully, this tutorial can give you some insights on how to do it.
Tutorial Objectives #
In this tutorial you'll learn the following:
- Install dependencies for ChartJS in a React project
- Understand ChartJS Data Structure
- Create a Simple Backend API for ChartJS Data
- Implement User Interaction
- Update ChartJS Data based on API
Final Output #
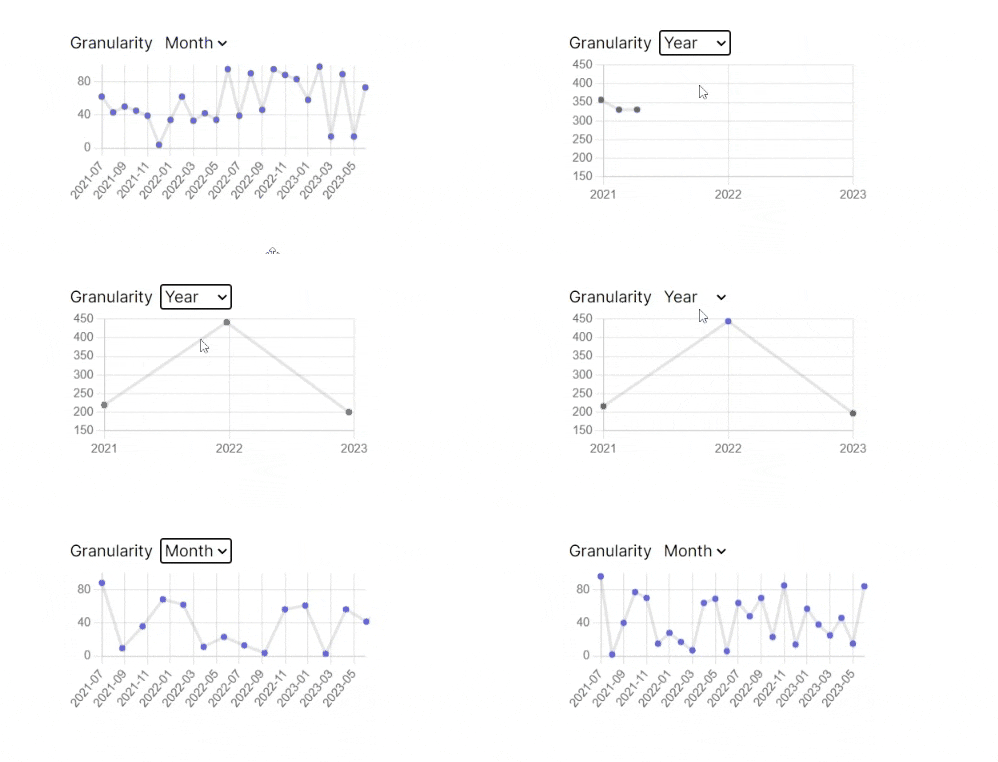
Here's the final output, basically we'll just update the chart data and modify the granularity based on monthly, or yearly statistics.

Step 0: Project Setup #
This step is optional since I assume you already have a React project in place. But if not, invoke the following command to create a new NextJS project:
npx create-next-app@latest --ts --use-yarn --tailwind --app chartjs-update-data-tutorialBy using the options --ts, --tailwind, and --use-yarn, this will initialize the project with Typescript and Tailwind and Yarn. The --app option will initialize the project with the /app folder as well since this is a next 13 project. This is my personal preference so you don't have to follow it.
Next is to run the local dev server by invoking the following commands:
cd chartjs-update-data-tutorial
yarn dev
Step 1: Installing Dependencies #
First, let's install chart.js and react-chartjs-2 in our project by invoking the following command in the command line:
yarn add chart.js react-chartjs-2Next, install the Optional dependency that's used for data generation:
yarn add dayjsWe'll use dayjs to easily format the labels in the next step:
Step 2: Implementing a Simple Backend API for Data #
This step is also optional. I assume that you already have a backend API or you already know where your data is coming from but if not, you can follow this step.
First, create the file /app/chartdata/route.ts and copy the following code:
// app/chartdata/route.ts import dayjs from "dayjs"; import { NextRequest, NextResponse } from "next/server"; /** * Simulate call to database and project the data that the frontend needs * @returns chart JS labels and data */ export async function GET(req: NextRequest) { const searchParams = new URLSearchParams(req.nextUrl.search); const groupBy = searchParams.get("groupBy") ?? "month"; // month/year if (groupBy === "month") { const months = new Array(24).fill("x").map((x, index) => { return dayjs() .subtract(24 - index, "month") .format("YYYY-MM"); }); return NextResponse.json({ labels: months, data: new Array(24).fill("x").map((x) => Math.floor(Math.random() * 100)), }); } else if (groupBy == "year") { const years = new Array(3).fill("x").map((x, index) => { return dayjs() .subtract(2 - index, "year") .format("YYYY"); }); return NextResponse.json({ labels: years, data: new Array(3).fill("x").map((x) => Math.floor(Math.random() * 1000)), }); } else { return new NextResponse("Bad request", { status: 400 }); } }1234567891011121314151617181920212223242526272829303132333435363738
Explanation:
First, we created a route.ts file since it is a special file convention for handling API routes in NextJS 13 /app folder.
On line 9, we create an async GET function to be able to handle requests coming to the /chartdata route.
On lines 10 & 11: Extract the groupBy search params from the URL. If there's no value, we set the default to "month".
On lines 13-37: We generate random data based on the groupBy property.
If you try to go to the following URL: http://localhost:3000/chartdata?groupBy=year, you'll get something like below:
// 20230728171845
// http://localhost:3000/chartdata?groupBy=year

{
  "labels": [
    "2021",
    "2022",
    "2023"
  ],
  "data": [
    260,
    693,
    779
  ]
}123456789101112131415
Creating a Chart Component #
Now that we have an API to get the data from, let's create a custom component. First, create the file, components/MyChart.tsx.
import React, { useEffect, useState } from "react"; import { Line } from "react-chartjs-2"; import { Chart as ChartJS, Tooltip, CategoryScale, LinearScale, PointElement, LineElement, } from "chart.js"; ChartJS.register( CategoryScale, LinearScale, PointElement, LineElement, Tooltip ); type ApiReturnType = { labels: string[]; data: any[]; }; const MyChart = () => { const [groupBy, setGroupBy] = useState("month"); const [data, setData] = useState<any[]>(); const [labels, setLabels] = useState<string[]>([]); useEffect(() => { const url = new URL("/chartdata", location.origin); url.searchParams.set("groupBy", groupBy); fetch(url.toString()) .then((response) => { if (response.ok) { return response.json(); } }) .then((_data: ApiReturnType) => { setData(_data.data); setLabels(_data.labels); }); }, [groupBy]); return ( <div> <Line data={{ datasets: [ { data, backgroundColor: "#6366f1", }, ], labels, }} /> </div> ); }; export default MyChart;1234567891011121314151617181920212223242526272829303132333435363738394041424344454647484950515253545556575859
Explanation:
On lines 3-18: We're just importing and registering components that the <Line/> chart needs. If you're using another chart type, you'll have to register other components.
On lines 24-26: We create data, labels, and groupBy states. These states will change based on the user interaction later.
On lines 27-40: We have a simple useEffect hook that fetches the data and sets the data and labels state appropriately. This is where the magic happens. It's not the optimal way to fetch data but I'm only doing this for tutorial purposes.
On lines 43-55: We're just rendering the <Line/> chart component from react-chartjs-2 based on the labels and data.
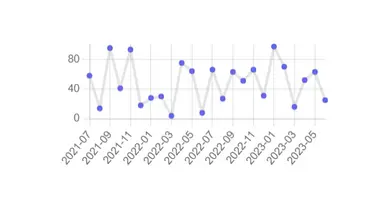
After this step, you should have the following output or similar:

Implementing User Interaction #
Next, let's add an input element that changes the state of the groupBy state. To do this we're just going to insert the following lines:
// ...
const MyChart = () => {
 //...

  return (
    <div>
      <div className="flex gap-2">
        <p>Granularity</p>
        <select
          onChange={(e) => {
            setGroupBy(e.target.value);
          }}
        >
          <option value={"month"}>Month</option>
          <option value="year">Year</option>
        </select>
      </div>
      <Line
        data={{
          datasets: [
            {
              data,
              backgroundColor: "#6366f1",
            },
          ],
          labels,
        }}
      />
    </div>
  );
};12345678910111213141516171819202122232425262728293031
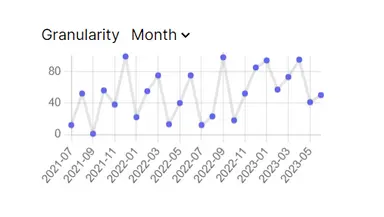
After this step you should have the following output:

That's basically it! You can change the granularity and watch as the data re-renders randomly.
Conclusion #
You learned how to update the data in ChartJS in React by using the react-chartjs-2 library. Since we changed the data and labels props in the <Line/> component, react-chartjs-2 re-renders it automatically.
If you like this tutorial, please leave a like or share this article. For future tutorials like this, please subscribe to our newsletter or follow me on GitHub.
Resources #
Credits: Image by Karl Egger from Pixabay


